
People
Everyone CivicGate tracks, in one place. Sort and filter by type, party, state, and money. Coverage is honest — sub-types and issue/vote filters fill in as they land.
Looking for who represents you? Find your representatives → · ⤓ Export CSV
The U.S. House has 435 voting members, apportioned by state population, each serving a two-year term. Learn more →
10 people8 D · 2 R
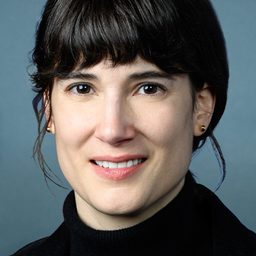 Marie Gluesenkamp Perez Marie Gluesenkamp Perez | Democratic | WA | 3 | 4 | 26 / 205 (231) | 100% | $6,292,683 |
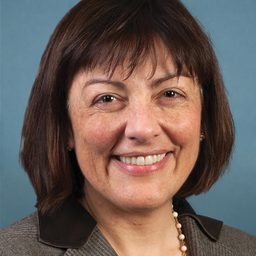 Suzan K. Delbene Suzan K. Delbene | Democratic | WA | 1 | 15 | 16 / 574 (590) | 100% | $3,550,452 |
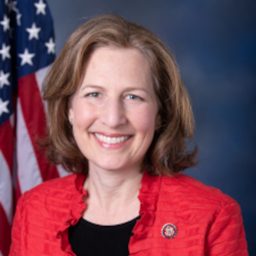 Kim Schrier Kim Schrier | Democratic | WA | 8 | 8 | 24 / 367 (391) | 100% | $3,016,894 |
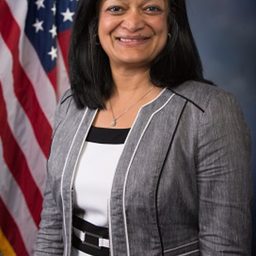 Pramila Jayapal Pramila Jayapal | Democratic | WA | 7 | 10 | 51 / 549 (600) | 100% | $2,502,816 |
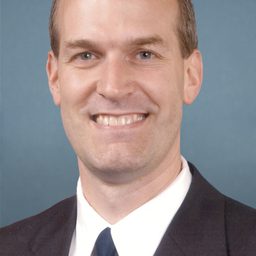 Rick Larsen Rick Larsen | Democratic | WA | 2 | 26 | 16 / 249 (265) | 100% | $2,038,786 |
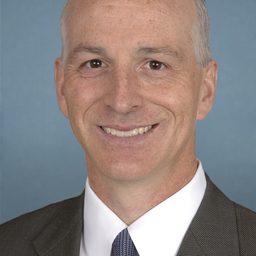 Adam Smith Adam Smith | Democratic | WA | 9 | 30 | 27 / 380 (407) | 59% | $1,882,001 |
 Michael Baumgartner Michael Baumgartner | Republican | WA | 5 | 2 | 23 / 184 (207) | 100% | $1,738,226 |
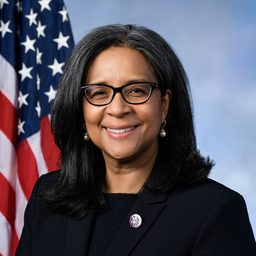 Marilyn Strickland Marilyn Strickland | Democratic | WA | 10 | 6 | 30 / 365 (395) | 100% | $1,511,304 |
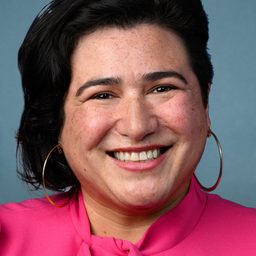 Emily Randall Emily Randall | Democratic | WA | 6 | 2 | 14 / 405 (419) | 100% | $1,195,247 |
 Dan Newhouse Dan Newhouse | Republican | WA | 4 | 12 | 29 / 206 (235) | 100% | $718,856 |
Bills = sponsored / cosponsored (total). Part. = roll-call participation. Money = contributions received. Coverage is partial; "—" means not recorded yet.