
People
Everyone CivicGate tracks, in one place. Sort and filter by type, party, state, and money. Coverage is honest — sub-types and issue/vote filters fill in as they land.
Looking for who represents you? Find your representatives → · ⤓ Export CSV
The U.S. House has 435 voting members, apportioned by state population, each serving a two-year term. Learn more →
17 people14 D · 3 R
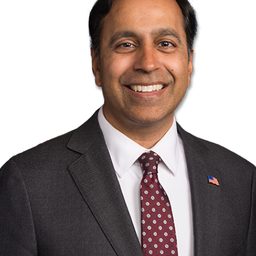 Raja Krishnamoorthi Raja Krishnamoorthi | Democratic | IL | 8 | 10 | 43 / 741 (784) | 100% | $3,916,222 |
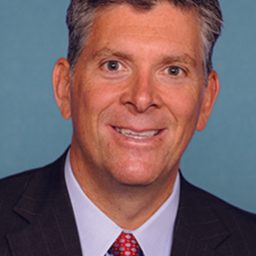 Darin Lahood Darin Lahood | Republican | IL | 16 | 12 | 39 / 181 (220) | 100% | $3,672,739 |
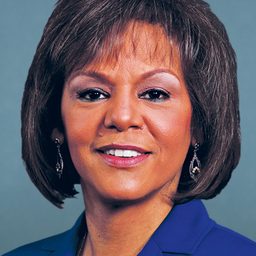 Robin L. Kelly Robin L. Kelly | Democratic | IL | 2 | 14 | 22 / 452 (474) | 100% | $3,509,919 |
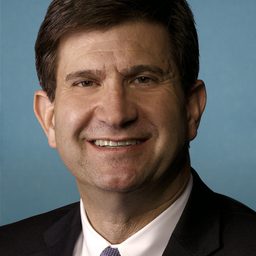 Bradley Scott Schneider Bradley Scott Schneider | Democratic | IL | 10 | 13 | 30 / 393 (423) | 100% | $3,006,863 |
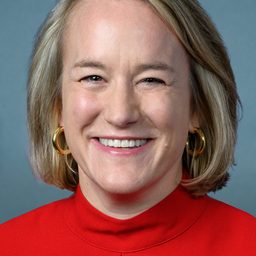 Nikki Budzinski Nikki Budzinski | Democratic | IL | 13 | 4 | 19 / 488 (507) | 100% | $2,885,018 |
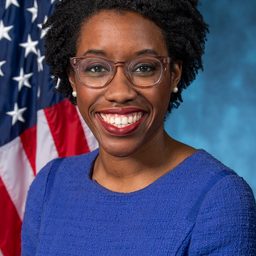 Lauren Underwood Lauren Underwood | Democratic | IL | 14 | 8 | 38 / 252 (290) | 100% | $2,417,082 |
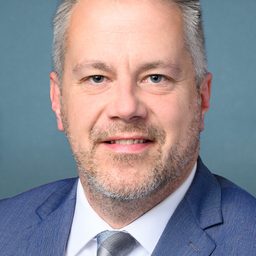 Eric Sorensen Eric Sorensen | Democratic | IL | 17 | 4 | 12 / 378 (390) | 100% | $2,233,676 |
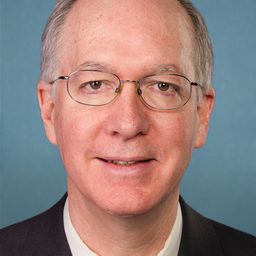 Bill Foster Bill Foster | Democratic | IL | 11 | 18 | 39 / 258 (297) | 100% | $2,180,937 |
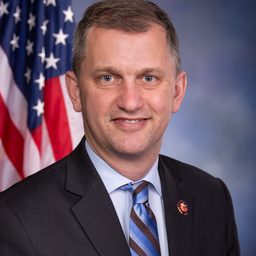 Sean Casten Sean Casten | Democratic | IL | 6 | 8 | 50 / 356 (406) | 100% | $2,108,920 |
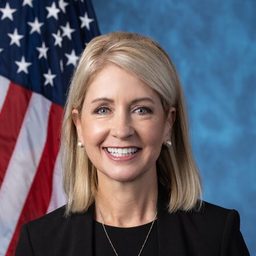 Mary E. Miller Mary E. Miller | Republican | IL | 15 | 6 | 35 / 318 (353) | 59% | $1,331,399 |
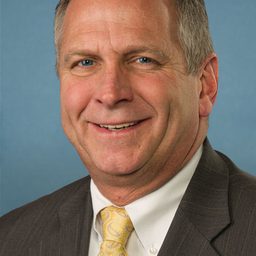 Mike Bost Mike Bost | Republican | IL | 12 | 12 | 24 / 300 (324) | 100% | $1,327,225 |
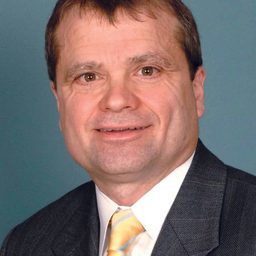 Mike Quigley Mike Quigley | Democratic | IL | 5 | 18 | 14 / 518 (532) | 100% | $725,695 |
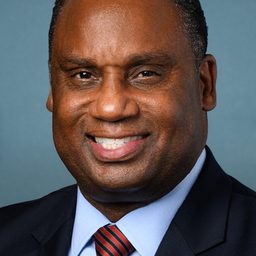 Jonathan L. Jackson Jonathan L. Jackson | Democratic | IL | 1 | 4 | 9 / 563 (572) | 100% | $418,350 |
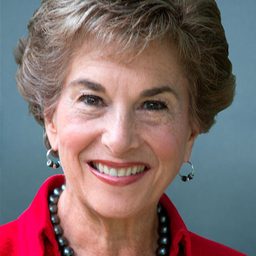 Janice D. Schakowsky Janice D. Schakowsky | Democratic | IL | 9 | 28 | 42 / 610 (652) | 88% | $412,978 |
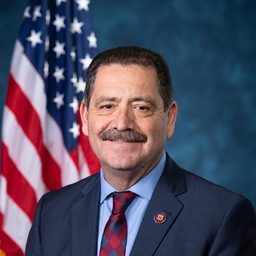 JesúS G. "Chuy" GarcíA JesúS G. "Chuy" GarcíA | Democratic | IL | 4 | 8 | 9 / 576 (585) | 100% | $375,959 |
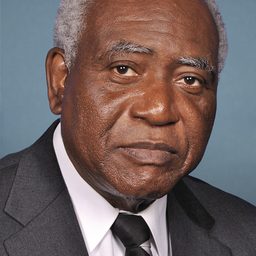 Danny K. Davis Danny K. Davis | Democratic | IL | 7 | 30 | 22 / 617 (639) | 100% | $91,781 |
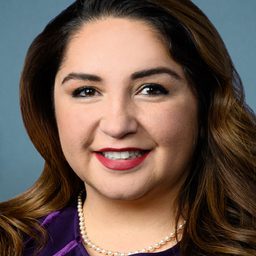 Delia C. Ramirez Delia C. Ramirez | Democratic | IL | 3 | 4 | 28 / 532 (560) | 88% | $0 |
Bills = sponsored / cosponsored (total). Part. = roll-call participation. Money = contributions received. Coverage is partial; "—" means not recorded yet.