
People
Everyone CivicGate tracks, in one place. Sort and filter by type, party, state, and money. Coverage is honest — sub-types and issue/vote filters fill in as they land.
Looking for who represents you? Find your representatives → · ⤓ Export CSV
The U.S. House has 435 voting members, apportioned by state population, each serving a two-year term. Learn more →
8 people4 D · 4 R
 Gabe Evans Gabe Evans | Republican | CO | 8 | 2 | 22 / 238 (260) | 100% | $5,393,673 |
 Jeff Hurd Jeff Hurd | Republican | CO | 3 | 2 | 26 / 190 (216) | 100% | $3,552,599 |
 Jason Crow Jason Crow | Democratic | CO | 6 | 8 | 34 / 266 (300) | 100% | $3,177,447 |
 Joe Neguse Joe Neguse | Democratic | CO | 2 | 8 | 88 / 588 (676) | 100% | $2,742,281 |
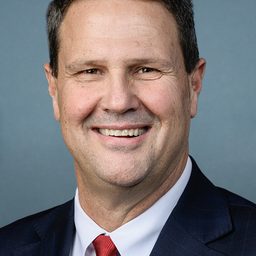 Jeff Crank Jeff Crank | Republican | CO | 5 | 2 | 8 / 131 (139) | 100% | $2,177,288 |
 Brittany Pettersen Brittany Pettersen | Democratic | CO | 7 | 4 | 41 / 408 (449) | 100% | $1,866,765 |
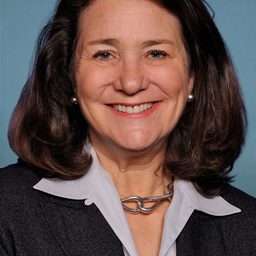 Diana Degette Diana Degette | Democratic | CO | 1 | 30 | 15 / 294 (309) | 100% | $1,671,531 |
 Lauren Boebert Lauren Boebert | Republican | CO | 4 | 6 | 19 / 248 (267) | 67% | $1,010,297 |
Bills = sponsored / cosponsored (total). Part. = roll-call participation. Money = contributions received. Coverage is partial; "—" means not recorded yet.