
People
Everyone CivicGate tracks, in one place. Sort and filter by type, party, state, and money. Coverage is honest — sub-types and issue/vote filters fill in as they land.
Looking for who represents you? Find your representatives → · ⤓ Export CSV
The U.S. House has 435 voting members, apportioned by state population, each serving a two-year term. Learn more →
9 people3 D · 6 R
 Elijah Crane Elijah Crane | Republican | AZ | 2 | 4 | 22 / 227 (249) | 100% | $9,481,428 |
 Juan Ciscomani Juan Ciscomani | Republican | AZ | 6 | 4 | 32 / 319 (351) | 100% | $6,172,867 |
 Adelita S. Grijalva Adelita S. Grijalva | Democratic | AZ | 7 | 2 | 11 / 399 (410) | 100% | $2,285,639 |
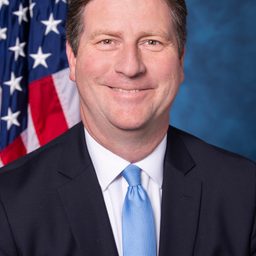 Greg Stanton Greg Stanton | Democratic | AZ | 4 | 8 | 28 / 345 (373) | 100% | $2,117,114 |
 David Schweikert David Schweikert | Republican | AZ | 1 | 16 | 32 / 96 (128) | 100% | $1,704,579 |
 Yassamin Ansari Yassamin Ansari | Democratic | AZ | 3 | 2 | 32 / 542 (574) | 100% | $1,435,713 |
 Abraham J. Hamadeh Abraham J. Hamadeh | Republican | AZ | 8 | 2 | 33 / 261 (294) | 100% | $1,206,361 |
 Paul A. Gosar Paul A. Gosar | Republican | AZ | 9 | 16 | 26 / 256 (282) | 67% | $580,043 |
 Andy Biggs Andy Biggs | Republican | AZ | 5 | 10 | 112 / 230 (342) | 33% | $28,246 |
Bills = sponsored / cosponsored (total). Part. = roll-call participation. Money = contributions received. Coverage is partial; "—" means not recorded yet.