
California's 12th District
Who represents California's 12th District, the federal money flowing to it, and what's on the ballot next. Data is coverage-honest — sections fill in as they land.
Discussion
Issues residents have reported here, newest first, each linked to its discussion. Report one without leaving the page.
CAStateno place set
Showing
What people are raising about CA.
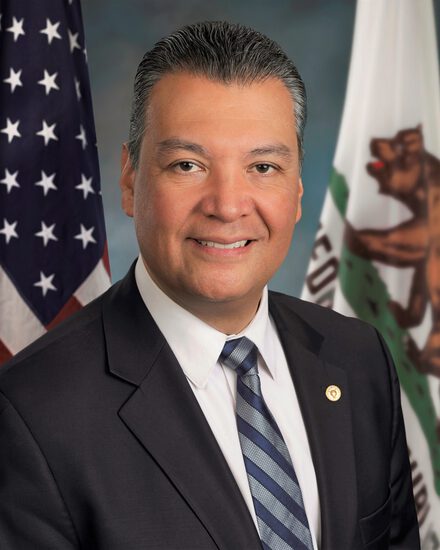
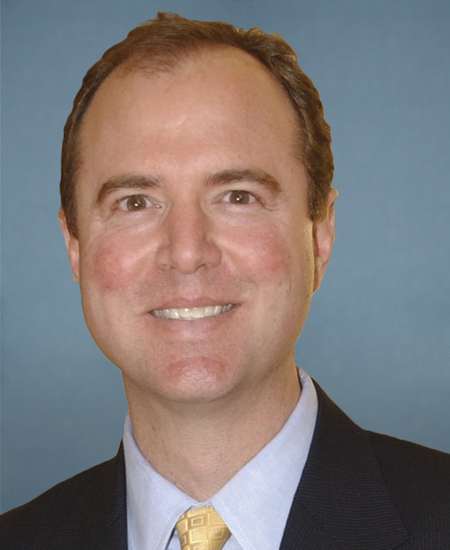
Your representatives

Where it is
Loading district map…
Demographics
Data from Census ACS — ACS 5-year, 2023
- Population
- 746,726
- Median household income
- $105,647
- Median age
- 37.8 yrs
- Bachelor's degree or higher
- 53.6%
Race & ethnicity
Hispanic or Latino origin (any race): 176,275 · 23.6%. Ethnicity is counted separately from race, so it doesn't add to the bars above.
Federal money to the district
| FY | Federal spending |
|---|---|
| 2017 | $2,517,502,892 |
| 2018 | $2,898,976,801 |
| 2019 | $2,490,097,794 |
| 2020 | $3,009,709,117 |
| 2021 | $3,641,867,474 |
| 2022 | $2,950,300,545 |
| 2023 | $3,140,478,211 |
| 2024 | $3,696,288,490 |
| 2025 | $3,535,823,470 |
| 2026 | $3,395,576,604 |
Upcoming elections
No upcoming elections are on file for CA right now.
Election administration
Who administers elections in CA, and where to check how and when to vote. Elections are run by the state, not the federal government.
The state election office of record for CA isn't loaded yet — use the official tools below to find your ballot and your local election office.
How to vote here
- CA state elections hub — who runs elections + how to vote →
- Upcoming elections in CA
- Find your local election office — FVAP office search ↗ (county/municipal offices aren't loaded in CivicGate yet)
Past elections
Sources
- Congress.gov · Congress.gov
- Congress.gov · Congress.gov
- Congress.gov · Congress.gov
- USAspending · USAspending